
IPTV Reseller Customer Lifetime Value is the total gross profit one subscriber produces before they stop renewing. The most reliable way to work it out is to follow a group of customers who joined in the same month, record how many are still paying in each month that follows, and multiply those surviving customer-months by your margin per month. Divide that total by the number of customers who started, and you have a lifetime value that reflects how your own subscribers behave rather than an average borrowed from someone else’s business.
Margin is where most first attempts go wrong. A £12 monthly subscription is not worth £12 to you once the credit it consumes, the payment fee and the time spent on setup questions come out of it, and a figure built on revenue alone will flatter every decision it informs, from advertising spend to whether an annual discount makes sense. Retention needs the same care. In many subscription businesses the first renewal is where the largest drop happens, so a single churn rate averaged across your whole customer base hides exactly the shape that makes the calculation useful.
[ez-toc]
Start With Margin per Subscriber-Month
Before touching retention, fix the unit you are measuring: one paying customer for one month. Everything else in the calculation is a count of these units, so the margin attached to each one needs to be honest.
Four costs belong inside it. The first is the credit. On many panels one credit covers one month for one connection, but deduction rules differ between providers and plan lengths, so check how IPTV credits are deducted for different plan lengths on your own panel before assuming a flat rate. The second is payment processing, whatever your card processor or payment platform takes per transaction. The third is support time, which most IPTV panel resellers leave out because nobody invoices them for it. If an average customer takes six minutes of messages a month and you value your time at £10 an hour, that is £1.00 per customer-month. The fourth is refunds and chargebacks, which are better recorded in the month they occur than spread as an estimate.
Fixed overheads such as your website, domain and design work stay outside this figure. Lifetime value answers “what does one more customer add?”, and those costs do not change when one more customer joins.
For the rest of this article, the illustrative margin is:
- Selling price: £12.00 per month
- Credit cost: £2.50
- Payment fee: £0.50
- Support allowance: £1.00
- Margin per subscriber-month: £8.00
These are example figures chosen for easy arithmetic, not market prices. Replace each one with your own.
Grouping Subscribers Into Retention Cohorts
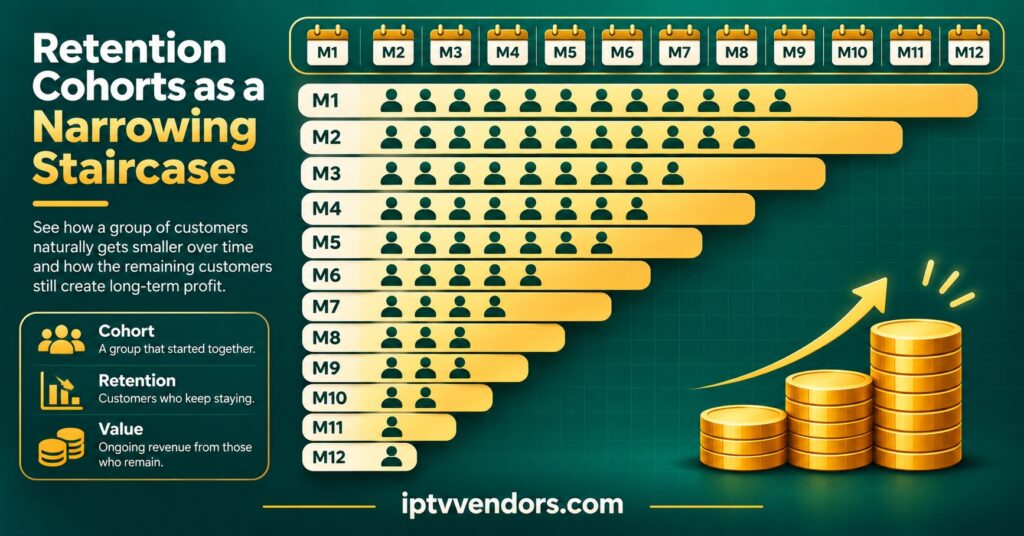
A cohort is every customer whose first paid subscription started in the same period. January’s new customers are one cohort, February’s another. You then track each group separately, month by month, counting how many are still paying.
Your reseller dashboard holds most of what you need, although not always in a form that exports neatly. For each customer you want the date of the first paid activation, every renewal date, the plan length, whether the account began as a free trial, and whether the customer belongs to you directly or to a sub-reseller. Many panels show current expiry dates but not a renewal history, so a simple sales log kept alongside the panel is often the only reliable record. A spreadsheet with one row per payment is enough.
Three definitions need settling before you count anything:
What counts as still paying. Decide on a grace window. A customer who renews four days after expiry has not really left, so treating renewals within, say, seven days of expiry as continuous keeps the data from showing churn that never happened.
When a customer joins. Use the first paid activation, never the trial. Trials belong in a conversion rate, which is a separate measurement.
What happens to returners. A customer who leaves in March and comes back in July is a reactivation. Keep them in their original cohort and mark the gap, rather than adding them to July as a new customer.
Small cohorts swing wildly. If a single month gives you only a dozen new customers, combine three months into a quarterly cohort so that one person’s decision does not move the curve by eight percentage points.
A Worked IPTV Reseller Customer Lifetime Value Calculation
Take an illustrative cohort of 40 customers who all started paid monthly subscriptions in the same month. The table below shows how many were still paying in each of their first twelve months, and the gross profit that month at £8.00 per subscriber-month.
| Month | Still paying | Gross profit |
|---|---|---|
| 1 | 40 | £320 |
| 2 | 31 | £248 |
| 3 | 27 | £216 |
| 4 | 24 | £192 |
| 5 | 22 | £176 |
| 6 | 21 | £168 |
| 7 | 20 | £160 |
| 8 | 19 | £152 |
| 9 | 18 | £144 |
| 10 | 18 | £144 |
| 11 | 17 | £136 |
| 12 | 16 | £128 |
| Total | 273 customer-months | £2,184 |
From cohort total to one figure
Divide the totals by the 40 customers who started. Each customer paid for an average of 6.83 months in the first year, and the twelve-month lifetime value is £2,184 ÷ 40 = £54.60 in gross profit.
The revenue version of the same calculation is 273 × £12 ÷ 40 = £81.90. That gap of £27.30 per customer is the reason to work in margin. A IPTV panel reseller who believes each customer is worth £82 will spend accordingly, and the extra £27 never existed.
Extending past month twelve
The first year rarely tells the whole story, because the customers still paying at month twelve are the steadiest ones. Looking at months nine to twelve, roughly 95% of survivors renew each month. If you assume that continues, you can project the tail.
Project cautiously. An open-ended projection at 95% monthly retention would credit those 16 survivors with around 304 more paying months, which is more than the cohort’s entire first year. That assumes nothing ever changes with your provider, your pricing or your customers’ circumstances. Capping the projection at 24 months in total is more defensible: it adds about 140 customer-months, or roughly £27.95 per starting customer, for a 24-month lifetime value of about £82.55.
Label any projected figure as a projection in your records. The first twelve months are measured. Everything after them is an assumption you will replace with real data as the cohort ages.
Payback month
The cumulative version of the table is often more useful than the final number. Per starting customer, the cohort had produced £8.00 by the end of month one, £14.20 by month two, £19.60 by month three and £24.40 by month four. If attracting a customer costs you £20 in advertising or affiliate fees, this cohort pays that back during its fourth month. Every customer who leaves before then has cost you money.
How Plan Length Bends the Numbers
The example above uses monthly payers, and that is deliberate. Mixing plan lengths in one cohort produces a curve that means nothing, because an annual customer cannot churn in month three even if they have stopped using the service.
Run annual payers as their own cohort and work out their margin per month separately. An annual plan sold at £99 uses twelve credits (£30 at the example rate), one payment fee (£0.50) and twelve months of support allowance (£12), leaving £56.50 for the year, or about £4.71 per month. That is well below the £8.00 monthly figure, but it is collected upfront and cannot churn for a year. Over the first twelve months, it slightly beats the £54.60 the monthly cohort produced per starting customer. Whether annual plans are the better product depends entirely on how many renew at month thirteen, and you will not know that until the first annual cohort reaches its anniversary.
Quarterly and six-month plans work the same way. Normalise the margin to a monthly figure, keep each plan length in its own cohort, and treat each renewal date as the only point at which churn can occur.
Refunds deserve particular attention with longer plans. A refund on a twelve-month package returns the customer’s money, but the credits spent on activation are not always recoverable, so a single refund can wipe out the margin from several other annual customers. Record it against the cohort in the month it happens.
Four Readings That Inflate or Shrink the Figure
Using one blended churn rate. The familiar shortcut divides margin by monthly churn. Applied to the example cohort, the first-month churn of 22.5% gives £8.00 ÷ 0.225 = £35.56, while the late-stage churn of about 5.9% gives £136. The measured twelve-month figure of £54.60 sits between them, and either shortcut would have misled you. The shortcut only works when churn is roughly constant across a customer’s life, and in a reseller business it rarely is.
Counting trials as customers. Including free trials in the starting count makes every cohort look as though it lost a third of its members in month one. Trials that never paid belong in your conversion rate, not your lifetime value.
Mixing in sub-reseller customers. When you sell credit allocations to sub-resellers, your margin is the difference between your credit cost and their wholesale price, and their customers’ retention is largely outside your control. That is a different unit of value with a different calculation, which is one reason the retail and wholesale reseller business models are worth measuring separately.
Treating returners as new customers. A customer who leaves and returns three times, counted as three new customers, makes acquisition look cheaper and lifetime value look shorter than either really is.

Decisions the Number Should Change
A lifetime value that sits in a spreadsheet does nothing. Its usefulness lies in the decisions it settles.
How much to spend acquiring a customer. Base this on the payback month rather than the full lifetime figure. Spending up to £54.60 to win a customer worth £54.60 over a year leaves no margin for error and ties up cash for twelve months. Deciding how quickly you need spend returned, and capping acquisition cost at the cumulative profit for that month, is a safer rule.
Where retention effort pays most. In the example, nine of forty customers leave at the first renewal, more than in any later month. A customer who survives into month two goes on to produce an average of about £60 in gross profit over the rest of the first year (233 remaining customer-months ÷ 31 survivors × £8.00). Keeping four more of those nine would therefore be worth roughly £240 to this cohort in its first year. That is the business case for better onboarding, clearer device setup and faster first-week support. Cohort-level churn tracking, covered in this subscription management guide for resellers, shows whether a change has actually moved that first drop.
Whether a discount is worth offering. Run any proposed discount through the margin per subscriber-month first. A 20% discount on a £12 plan cuts the margin from £8.00 to £5.60, so the discounted cohort needs to stay about 43% longer just to match the original lifetime value.
How much risk you are carrying. Every lifetime value assumes the service carries on. Your customers’ value depends on your upstream provider remaining stable and operating with proper distribution rights for what it delivers. A provider that disappears ends every customer’s lifetime at once, which is another reason to keep projections short and to choose suppliers whose licensing you have actually checked.
Recalculating Each Month: A Short Routine
- Export the month’s new paid activations, renewals and expiries from your panel, and reconcile them against your sales log
- Add the new month’s starters as a fresh cohort, separated by plan length
- Update the “still paying” count for every open cohort, applying your grace window consistently
- Recalculate margin per subscriber-month if credit prices, payment fees or support load have changed
- Record refunds and chargebacks against the cohort and month they belong to
- Compare the newest cohort’s first-renewal drop with earlier cohorts to see whether onboarding changes are working
- Replace projected months with actual data as cohorts age, and note where reality differed from the projection
- Revisit your acquisition spending limit if the payback month has moved
Questions Resellers Ask About Lifetime Value
How much data do I need before the figure is reliable?
At least three months for a monthly cohort shows you the first-renewal drop, which is the most important part of the curve. Six months gives a reasonable picture of where retention levels off. Until a cohort reaches twelve months, report lifetime value as “to date” and avoid projecting far beyond the data.
Should my own time really count as a cost?
Yes, if you want the figure to guide decisions. Leaving support time out makes customers who constantly need help look as valuable as those who never message you, and those are very different customers to acquire more of.
Can I rely on the figures shown in my reseller dashboard?
Dashboards typically show active connections, credit balance and expiry dates, which describe the present rather than history. They are a good input for reconciliation, but a cohort calculation usually needs a payment-level record that you keep yourself.
My customers mostly pay annually. What can I calculate now?
You can calculate margin per plan and track refund rates immediately, but true retention data arrives at the first anniversary. Until then, treat lifetime value for annual cohorts as one year of margin, and plan cash on the assumption that renewal rates are unknown.
Does a higher lifetime value mean I can raise prices?
Not on its own. A rising figure may come from better retention, lower credit costs or fewer support requests, and each points to a different decision. Look at which input changed before acting on the total.
What the Number Is For
IPTV Reseller Customer Lifetime Value is only as honest as the two inputs behind it: margin that includes credits, fees and your own time, and retention measured by cohort rather than averaged across everyone. The worked example shows how much the method matters. The same 40 customers can look like they are worth £36, £55, £82 or £136 depending on the shortcut taken, and only one of those figures is measured rather than assumed. Start with your most recent complete month of new monthly customers, build their first cohort row today, and let the curve fill in as they renew. The figure will be rough for a few months, but it will be yours, and it will sharpen with every month of real data.